
Silicon Valley’s “Data Center” Practice
Hello everyone, I am very honored to have the opportunity to share with you the data center practice of Silicon Valley. My name is Song Wenxin. After completing my PhD at Stony Brook University in the United States, I worked for Ask.com, a search engine company in Silicon Valley, as the head of the big data department. At that time, the market share of Ask.com search engine ranked fourth in the United States. The top three were Google, Microsoft and Yahoo. Then I joined EA (Electronic Arts), a game company in Silicon Valley, as a senior R&D manager in the digital platform department. During this period, I went through the process of building an EA data platform from 0 to 1. In August 2016, my roommate and I co-founded Wuhan Zhiling Cloud Technology Company, a big data architect at Twitter, to develop and promote enterprise-level big data operating systems. The following is the main content I will share today.
I hope that the following content can provide you with a reference from the side. It does not mean that Silicon Valley’s experience must be copied in its entirety, but you can see whether Silicon Valley’s methodology and technology in data center construction are helpful to your own business development.
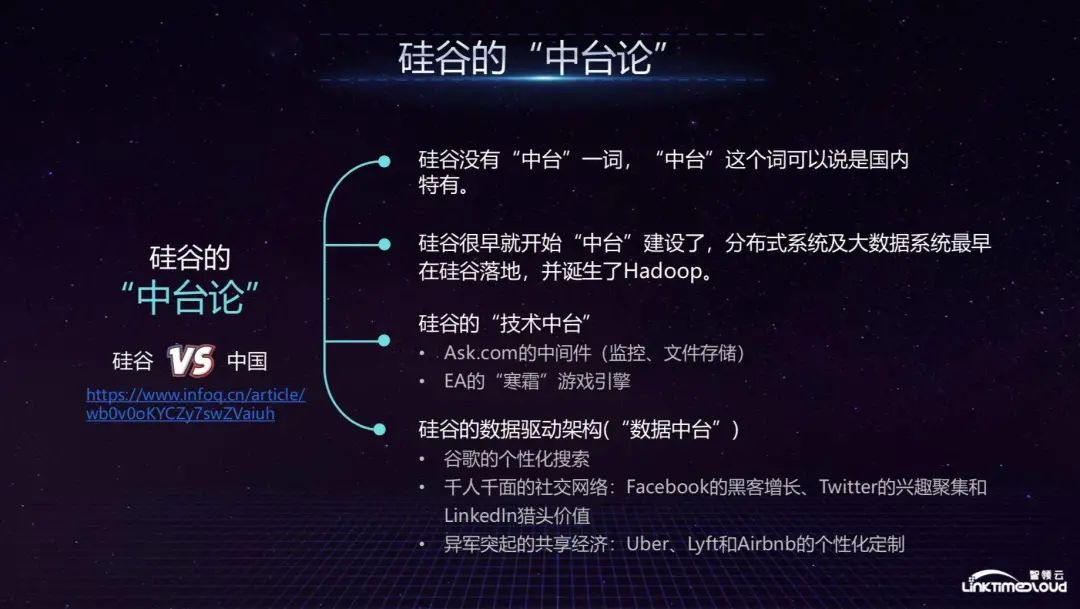
First, let me share with you the theory of middle platform in Silicon Valley. In fact, there is no such term as middle platform in Silicon Valley. This is unique to China and was first proposed by Alibaba. However, Silicon Valley has long had similar middle platform construction. For example, Hadoop combines distributed computing and distributed storage. Wait for the technology to be opened up as a middle platform, allowing developers to share and reuse it.
During my tenure at Ask.com, our internal middleware team would make the monitoring system, file storage, etc. in the entire distributed system into components for use by the company's various technical departments. This is also an example of the external output of the technical middle office. In EA, the entire game company has a Frostbite game engine, which was originally created as a development engine for shooting games. The entire interface integrates many functions. Game developers can drag and drop the required styles and components to the development tool. When the Frostbite engine developed to the 3.0 stage, most of EA's games were developed through this platform, which was equivalent to the technology center of the game company. There are many such examples in Silicon Valley. This is what we are live broadcasting today. Content to share.
Of course, we first need to understand the concept of data middle platform. Simply put, data middle platform is built on the big data platform, focusing on the abstraction, sharing and reuse of data capabilities. Its purpose is to drive the company's business through numbers. Of course, about There are many ways to understand this, so I won’t go into details here. I will mainly share today’s main content—EA’s data center construction.
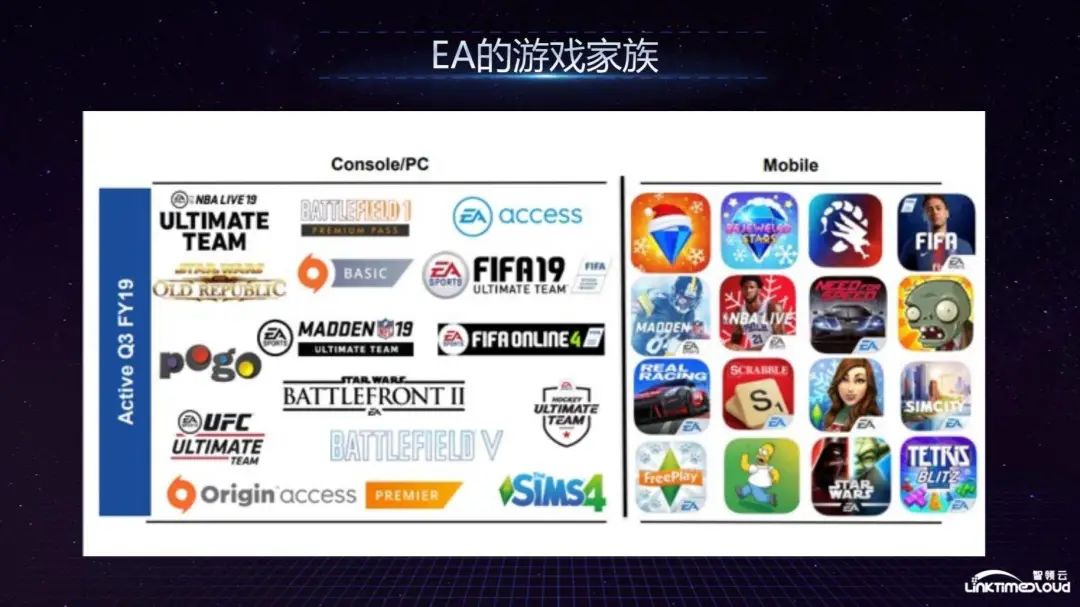
Let me first introduce you to EA's game family, as shown below. EA's games are divided into several categories: the first category is sports, and the more famous ones include FIFA football games, MADDEN football games, and NBA games; the second category is shooting, such as BATTLEFRONT; The third category is social games, similar to SIMS4.
In terms of Moblie, mobile games are relatively famous such as Plants vs. Zombies, which many people should have played, and RealRacing. At the iPhone launch conference in a certain year, RealRacing was used as a game to showcase the powerful hardware capabilities of the iPhone.
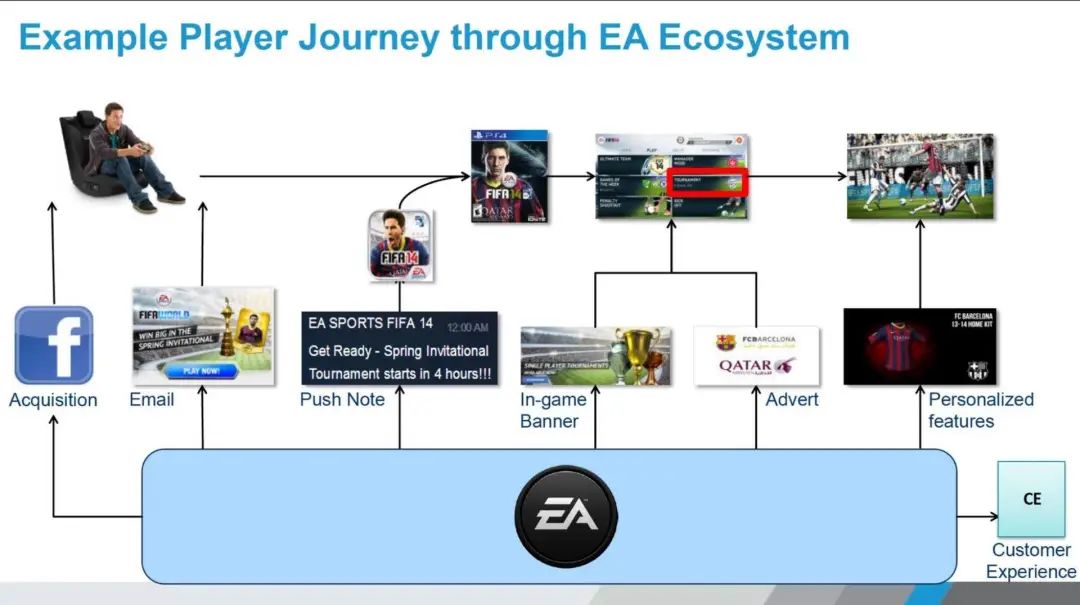
EA's big data department was established in 2012. The figure below shows the changes that occur at the data level when gamers play games. Looking from left to right, you first need to obtain player information through Facebook or email, and use data to discover potential Players, including Push Notification, notify players to invite them to enter the game. After entering the game, the place where the data plays an important role is the advertising display within the application, including the In-game Banner, which will have some personalization. Finally, it is the player’s experience. Including game experience, customer service experience, etc., this is where the entire EA backend data comes into play.
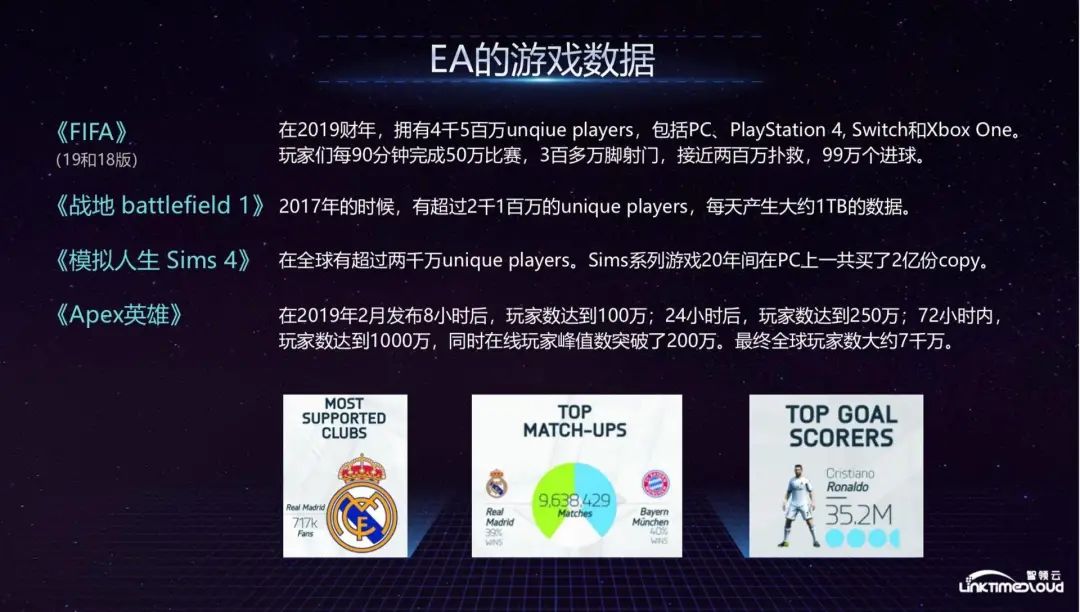
So, let's look at EA's game data next. Taking FIFA as an example, FIFA has 45 million Unqiue players in fiscal year 2019. These players can complete nearly 500,000 games and more than 3 million shots in 90 minutes. Considering EA has nearly a hundred games, and the total amount of data for these games is still very large.
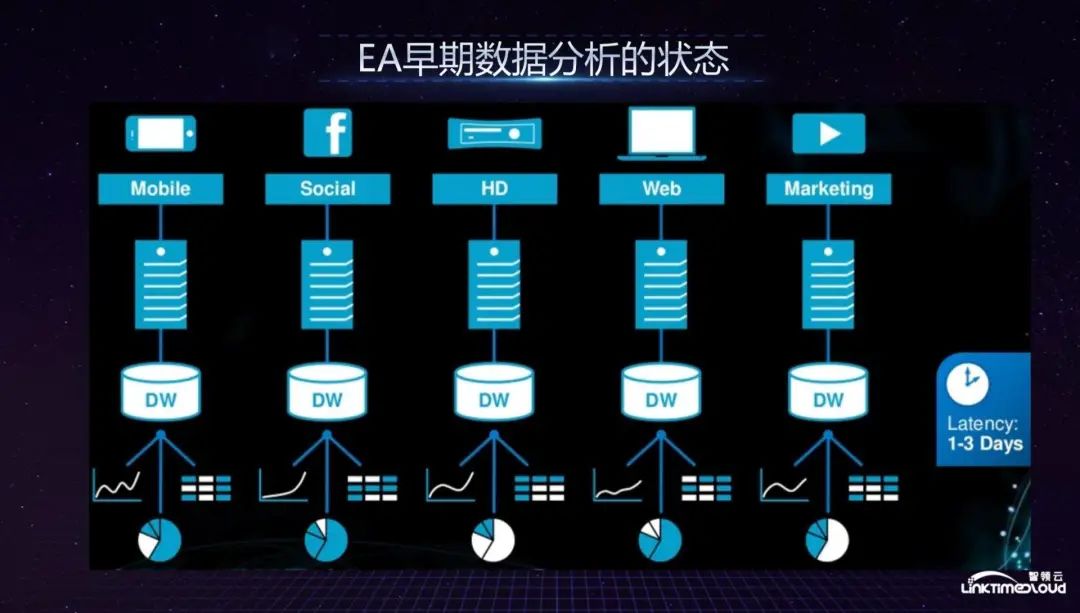
Faced with such a huge amount of data, how did EA conduct early data analysis? The characteristic of EA is that many game studios are distributed across the country, and most of them are acquired. Then each game studio will form its own chimney-style data analysis pipeline in the early stage according to business departments, and each game will have a set of data. Analysis pipeline, which leads to a large data delay. If you want to get a complete picture of the entire company's data, it will take two to three days to sort it out, because you have to go to each chimney to collect data. This led to the entire company in 2012. EA's game experience is not particularly good, game releases often experience downtime, and customer service is also very poor. The American Consumer Magazine rated it as one of the worst companies that year. This prompted EA's leadership to determine to change the status quo and start to establish a digital company. In the platform department, I joined EA at that time to build the entire data platform from 0 to 1.
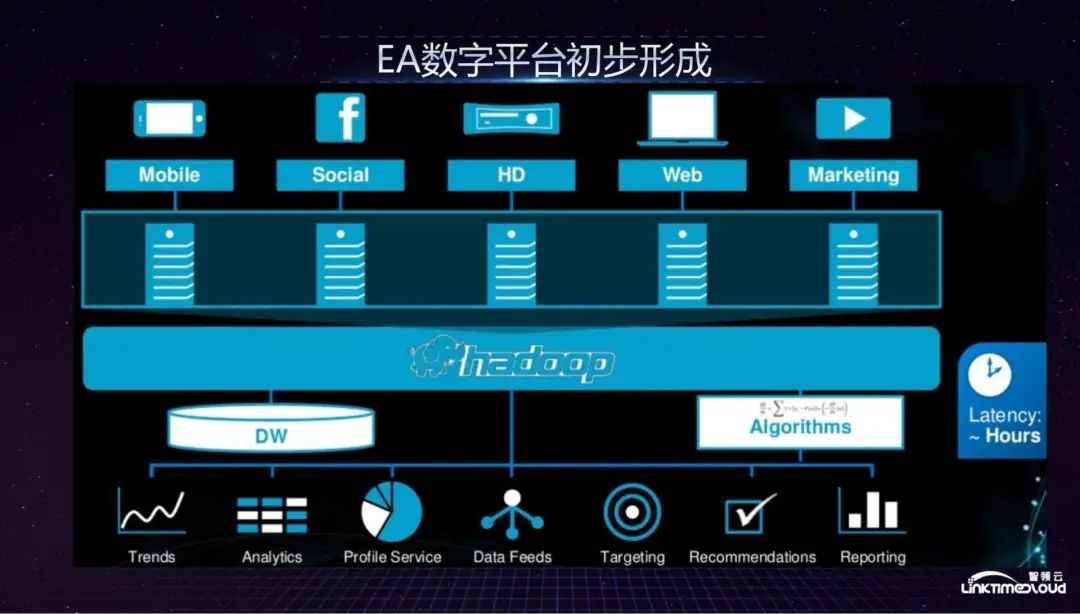
From 2014 to 2015, EA's digital platform was initially formed. Data from various game studios and business departments entered the Hadoop-based big data platform through a unified data pipeline, with unified data warehouses, services and algorithms to support it. For business department analysis, recommendations and reporting requirements, the data delay at this time is reduced from two to three days to a few hours.
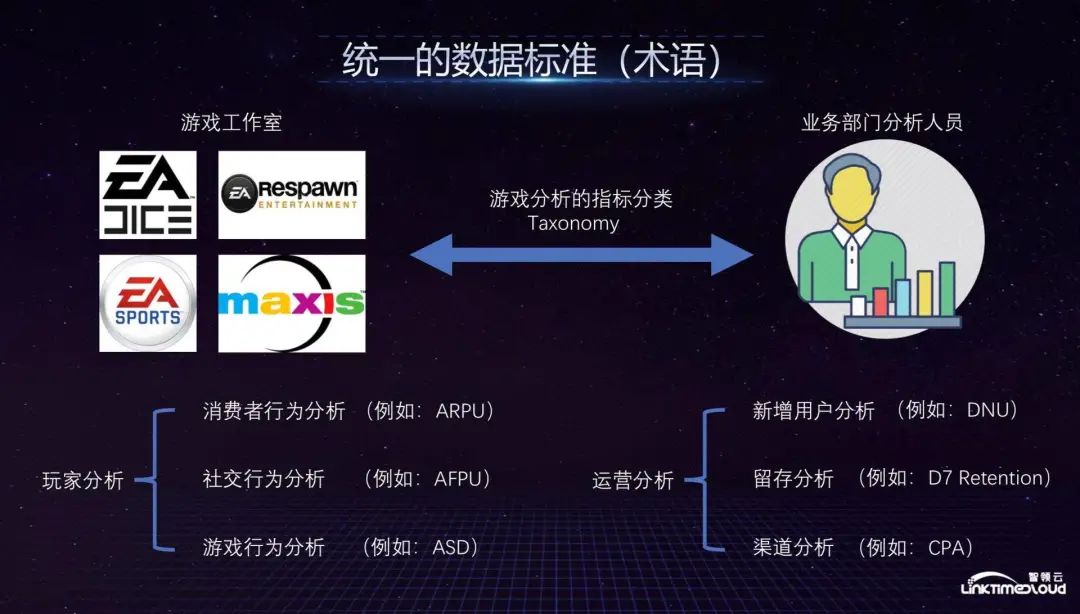
Specifically, the first thing the big data department did at that time was to establish unified data standards and data specifications throughout the company. No matter which game company or business department they used to talk about the same thing in the same language, we established the game The analysis indicator classification Taxonomy, taking player analysis as an example, requires unified data including player consumption behavior analysis, social behavior analysis and game behavior analysis, such as average game duration and other indicators. At the operational analysis level, new user analysis, retention analysis and channel analysis also need to be unified.
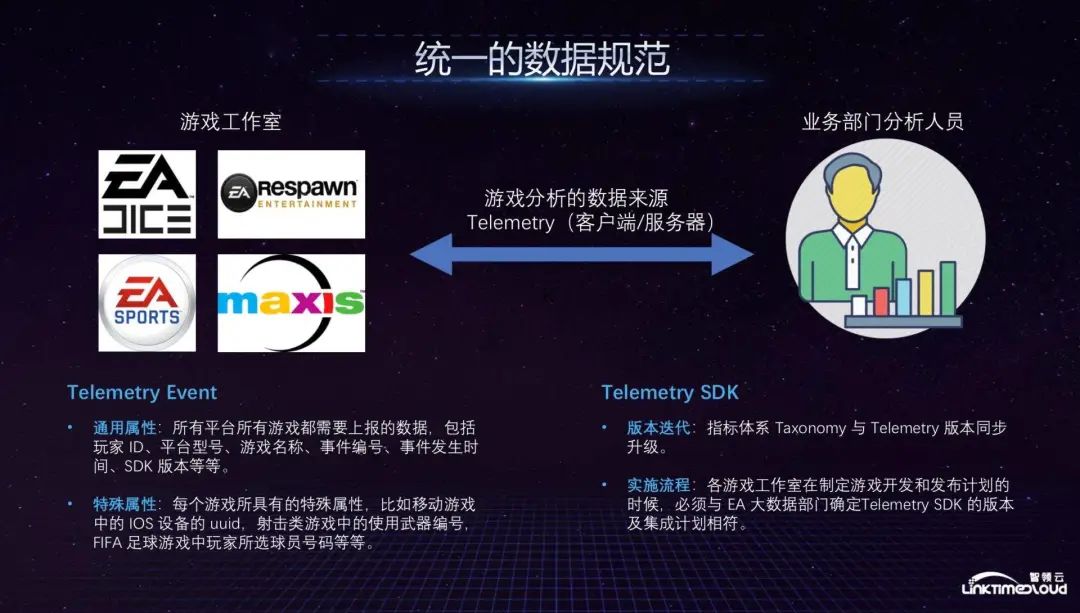
After the data standards were unified, we began to establish unified data specifications. So, what do data specifications mean? Game analysis data is sent from the client and server to our big data platform. It seems that the data is managed in a unified way and the smokestack is eliminated. However, in fact, because the data formats of different departments are different, the data itself is not unified. We have established a unified data source Telemetry, and defined the data sent by the client and server as an event, which is the Telemetry Evnet mentioned in the figure below. We have defined two types of attributes of the event, one is a general attribute, all platforms Games must report data, including player ID, game running device, game name, event number, event time, etc. After defining the data specifications, all data can be easily counted and some common indicators needed by the company can be calculated, such as Daily activity, monthly activity, etc.; the other type is special attributes, which will also have some special attributes according to different businesses. The whole process only needs to be implanted into the game client with the Telemetry SDK to complete.
After completing the above two steps, we can talk about the construction of data center in detail. First of all, the construction of data middle office must be business-driven. When we build data middle office, we hope to drive business development in a digital way, such as supporting game design and development, supporting game online services, supporting game marketing departments, and supporting player acquisition. Game advertising push, etc., this is the development direction of the entire data center. The construction steps are shown in the figure below.
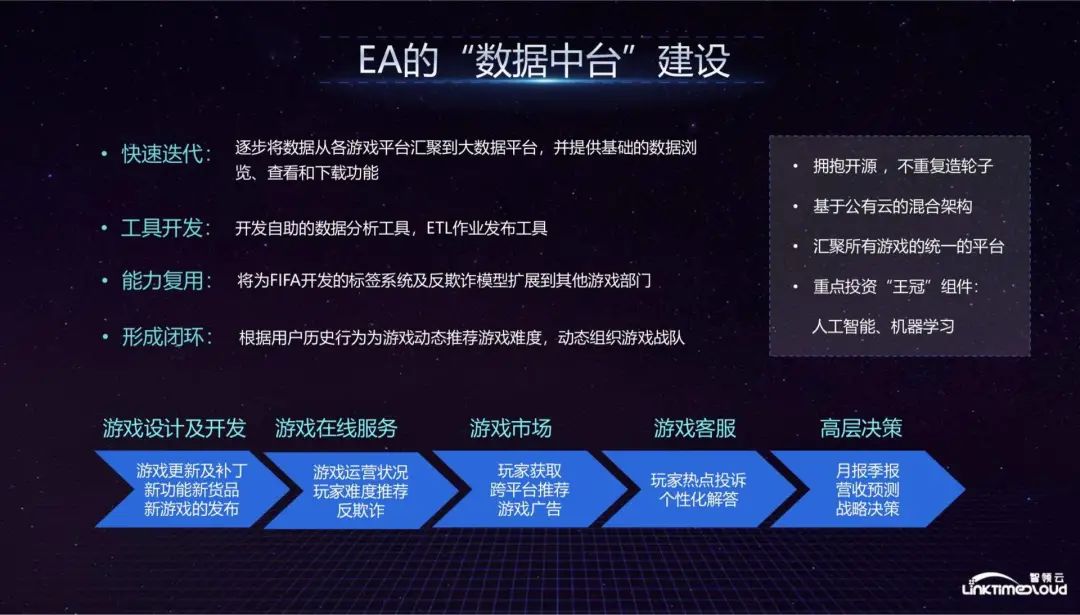
At first, our big data platform adopted a rapid iteration method, gradually aggregating data from various game platforms to the big data platform, and providing basic data browsing, viewing and downloading functions, because the investment in the construction of the data center is huge. Therefore, it must be effective quickly. This is another process that requires long-term investment. If there is no effect in the short term, the big data department, business department, and even the company's senior management involved will lack confidence in the subsequent construction, so we chose to iterate quickly. Method, initial results can be seen in the short term, but the function of this data center is very rudimentary. The effect is to pull data from various game departments to pulling data from a unified platform.
The second step is to enter the tool development stage. We have developed some self-service analysis tools so that business departments can conduct data analysis independently. Their daily work has been changed from the original Excel to a unified big data platform. This stage allows business departments to use the data. stand up.
The third step is to reuse capabilities. Taking FIFA, the main contributor to EA's revenue at the time, as an example, we developed a labeling system that allowed FIFA to quickly identify players from tens of millions of players who meet the requirements in terms of region, age, and average daily game time. players, and conduct targeted game promotions, push discount coupons and other preferential activities to promote more revenue. Similarly, we have also established an anti-fraud model. Players who accumulate game coins and then sell them at high prices will be punished by having their accounts blocked. These capabilities can be reused.
The fourth step is to form a closed loop, which is to form a service with the data obtained from the game and then feed it back to the game. The simplest is to feed back the user's game behavior to the students who make dynamic recommendations in the game, so that the recommendation results can be optimized.
To sum up, first of all, we will launch some new functions basically every quarter to gradually make the game run better. Each business department can use some new functions every quarter and feel the effect of the construction of the data center; Secondly, some self-service tools need to be developed to allow business departments to analyze data on their own; then, as much as possible, the functions developed for a certain business department should be abstracted and used; finally, a closed loop of data should be formed to feed back to the business to promote the business.
During the construction process, we also have some principles, which are basically adopted by technology companies in Silicon Valley to build data centers: first, embrace open source and not reinvent the wheel. For example, big data platforms are basically based on the Hadoop ecosystem; second, they are based on public In the hybrid cloud architecture, the game server is deployed in a private cloud, but the data center is deployed on the public cloud of AWS. The two can be connected to quickly expand the scale of the data center. The third is a unified platform that brings together all games. For EA, which is an annual company For a company that wants to release dozens of games, the difficulty in achieving this is not entirely in technology, but in persuading each business department to use a unified platform to support their business; fourth, it is necessary to focus on investing in "crown" components , the value that the data center can ultimately generate must be that the data is collected and processed, analyzed, and artificial intelligence machine learning algorithms allow it to generate greater value in the business. This is the focus of the entire platform. Next, we focus on the technical aspects.
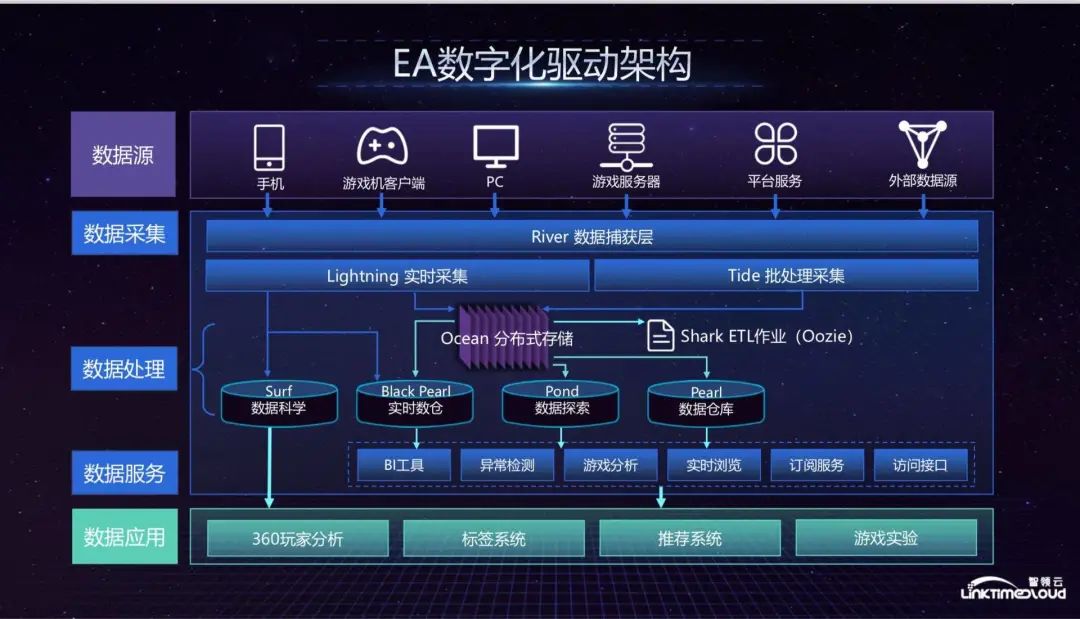
The above is EA's digital drive architecture. The top is EA's data sources, including mobile phones, game console clients, PCs and other channels. These data are sent to the data collection layer, which is the data capture layer River, through the Telemetry data format we defined. Data collection is divided into two parts: Lightning real-time collection and Tide batch collection. The architecture of the two will be introduced in detail later. The collected data enters Ocean distributed storage. The distributed storage is divided into two parts: HDFS-based distributed storage. File storage system and object-oriented storage of AWS S3 actually involve the issue of hot and cold storage. Because S3 is relatively cheap, it stores older data, while HDFS mainly stores relatively new business data. At the data processing level, the ETL workflow that matches Ocean is Shark, which continuously handles large amounts of data. We then made some modifications to Onzie and used it as a workflow management tool. Further down the data processing is the data warehouse, which stores some real-time player data and is mainly used in the field of data science, such as recommendation algorithms. Our real-time data warehouse is based on Couchbase. Pond is a self-service data exploration tool. Some of our production data will From Ocean Push to Pond, Pond can also directly read object-oriented storage data from S3 for query. Pond is also a small cluster for each business department to run jobs, supporting four to five hundred jobs every day, followed by the Pearl data warehouse. , this is a traditional data warehouse. We first used Tide. Later, because Tide was too expensive, we moved to AWS's Redshift data warehouse, which can provide support for traditional PI tools. The data warehouse layer also provides support for The following data services provide support.
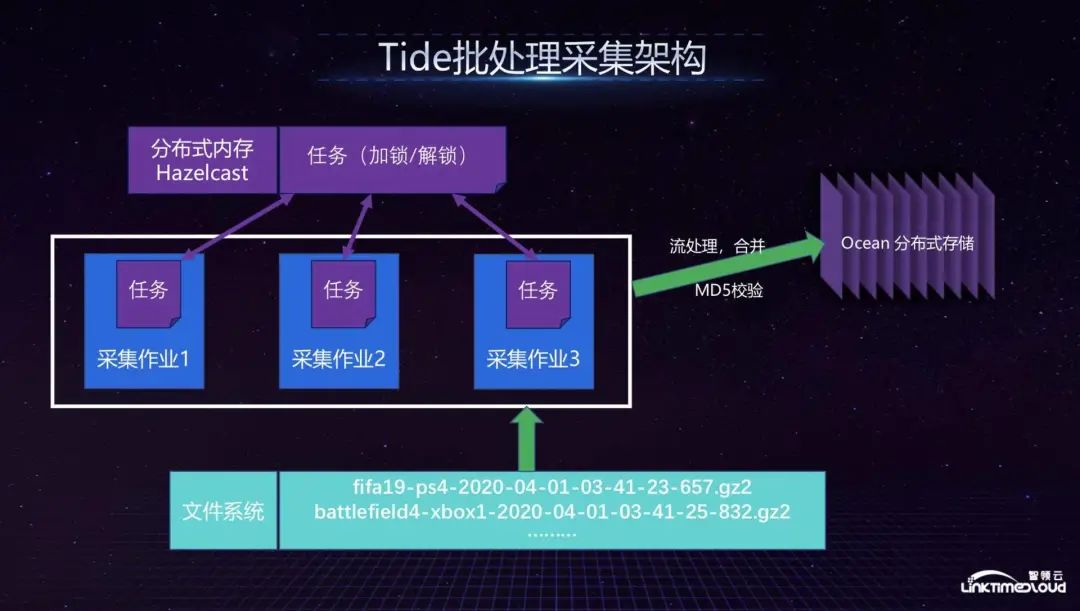
Next, I will introduce the Tide batch collection architecture in detail, because the entire batch file stores a large amount of data sent from the game server. Since there was no particularly suitable distributed system in the industry at that time, we built a distributed collection system ourselves. The problem solved is that each task can independently pull the files it wants to process from the file system. So, how to ensure that different tasks do not conflict with each other? We implement this through task locks, which are activated through Hazelcast distributed memory. If a file is locked, other tasks will not be able to get it. In the file stream processing part, we classified the collected files into different file streams for merge processing, and then published them to Ocean. We did not choose Flume at that time because Flume had just come out at the time, and we had too many customization needs, because we not only To merge files, there are many small files placed on Hazelcast, which will seriously affect performance. If we follow today's technology, we may use some newer systems to do the whole thing.
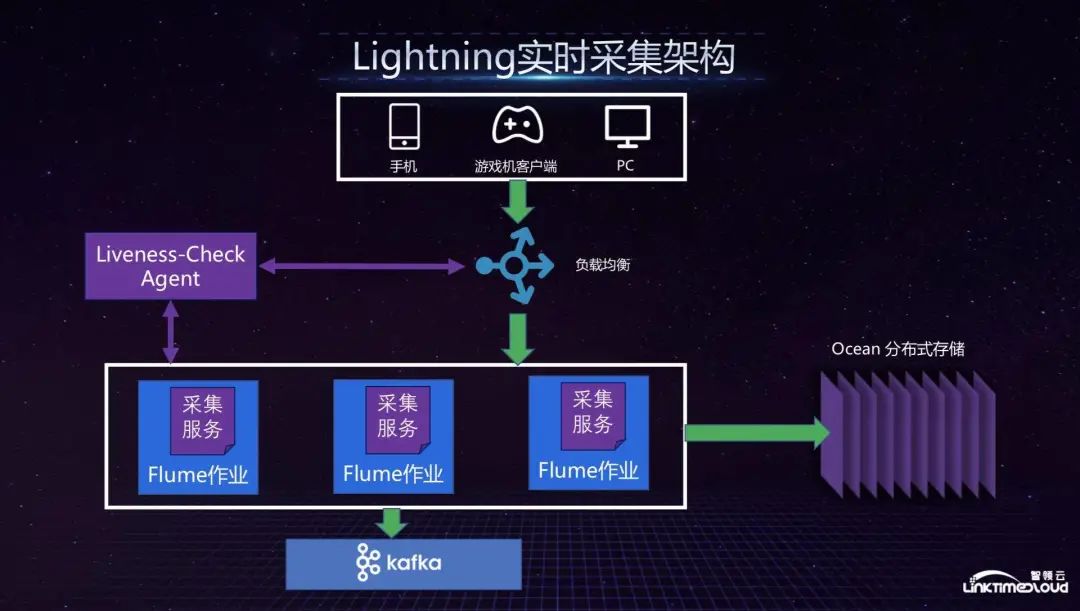
In the real-time collection service part, we have a setting for overall checking whether the collection node is working. We call it Liveness-Check. If a node is not working, it will notify the load balancer to remove it. If a new collection service is generated, it will This node is added to the load balancing, which means the load balancing is dynamically adjusted to ensure high availability of the service. In this architecture, we use the Flume service because the file method is relatively straightforward. One Flume job is sent to Oceam for backup, and the other is sent to the Kafka cluster. The more important consideration here is fault tolerance, which is collecting data. After the service node hangs up, how to ensure that the data is not lost? On the one hand, it is backed up through Ocean, and on the other hand, it is cut off after the service node hangs up so that the data is not destroyed.
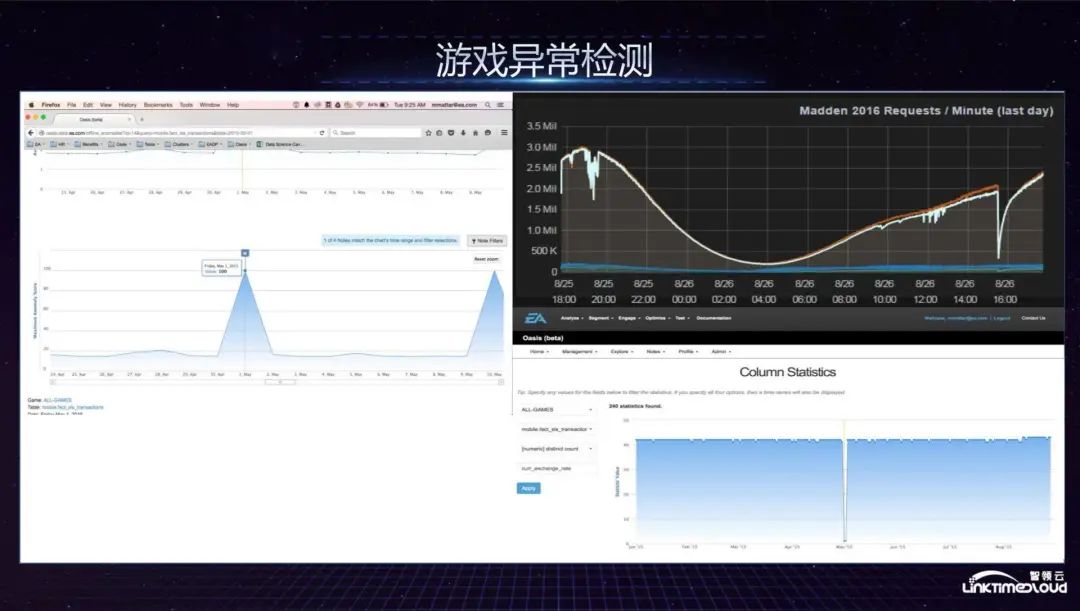
As for game anomaly detection, we mainly completed automatic configuration of game indicator detection. EA has hundreds of games. While releasing new games or versions every year, it also needs to maintain historical versions. There are nearly tens of thousands of indicators in the game indicator system, so Anomaly detection must be intelligent rather than manually configuring every indicator. In addition, we analyze anomalies by pulling historical data for machine learning modeling.
Next, we will focus on the game’s recommendation system, which is the fourth part of the data center and ultimately forms the part of the data closed loop. As a typical data capability, EA's game recommendation system first sends requests to the recommendation system from the game client and server, but there is a modeling process before that. In this process, the data from the client and server will be sent to the data warehouse. The warehouse sends data to the model and service module. Of course, this module will also store some codes, because EA can not only support various systems, such as recommendation systems, but also support anomaly detection and anti-fraud, among which the models and codes can Reuse in other departments.
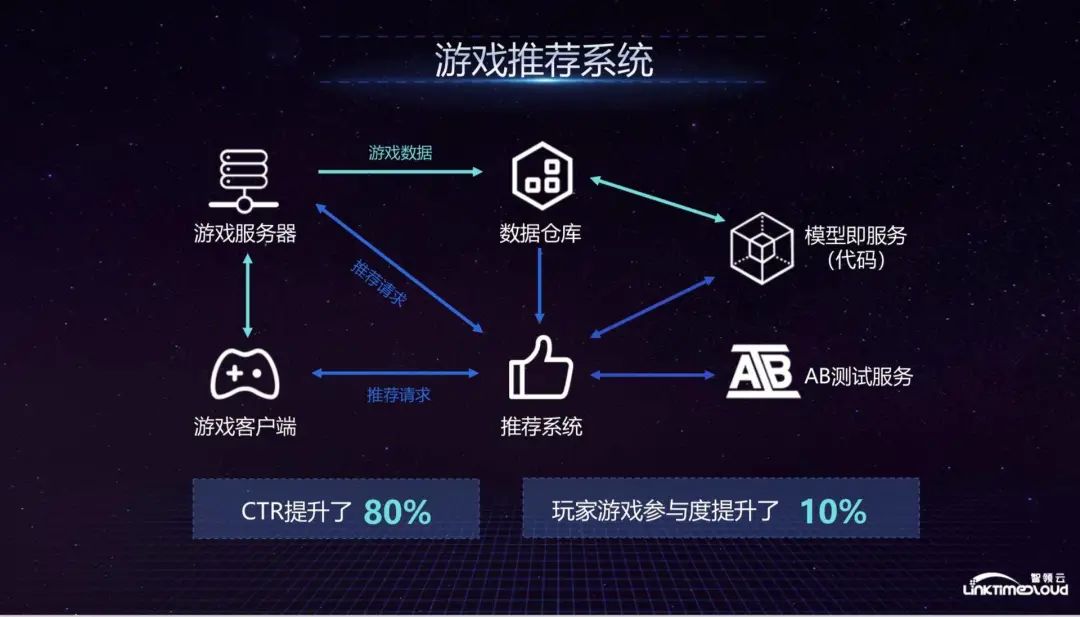
Then in the entire recommendation system, the recommendation system will pull the data of the data warehouse in the last 24 hours, and then make a request to the model and service. The model and service will calculate and match based on these parameters and return the results to the recommendation system. The recommendation system will then The results will be returned to the client and server to form the entire recommendation mechanism.
Another important part of the entire backend is the AB test. The recommendation system can be sent to different servers according to the different nature of the recommendation request (production environment or test environment), and will be bundled with a series of subsequent recommendation request data for evaluation. Is the entire result in line with expectations? The logic of the EA recommendation system is roughly the same. After the entire system is launched, it has a very obvious role in promoting the business. For example, the click-through rate of advertisements has increased by 80%, and the participation of game players has increased by 10%.
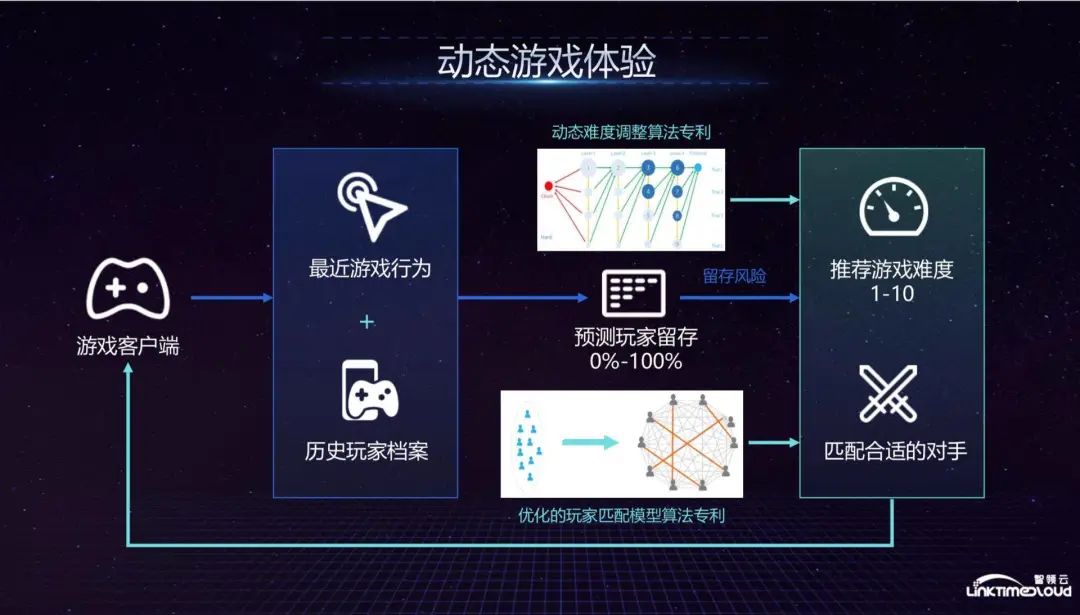
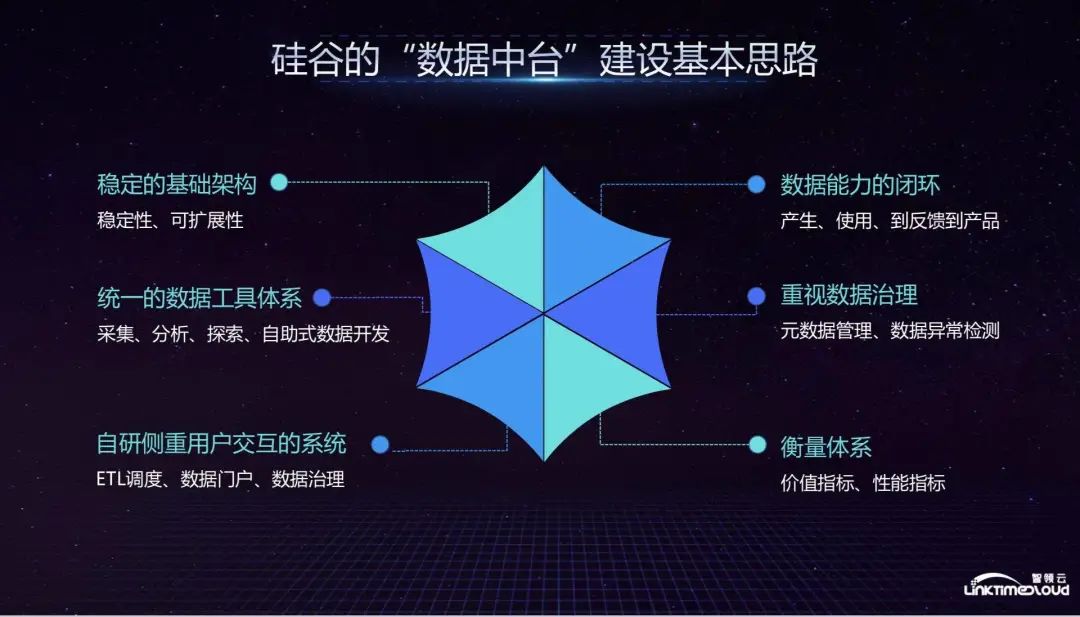
The ideas of other unicorns in Silicon Valley in building data centers are basically similar to the above. They first need to have a stable infrastructure, which is basically built based on the Hadoop ecosystem, and then add self-developed basic components and use unified data tools for management. and development; in the self-research part, the focus is on systems that focus on user interaction. The purpose is to allow each business department to use the system to develop data capabilities by themselves, including ETL scheduling, data portal and data governance functions; emphasizing data capabilities Closed loop, that is, a large amount of data is fed back into the product and greatly improves the business; emphasis on data governance, metadata management and data anomaly detection; measurement system, because the construction of the data center is a system that requires a lot of investment and needs to be able to measure Find out which business department uses the most and which links consume the most resources.

Next, we briefly introduce Twitter's data center architecture, which is basically similar to the EA architecture. From top to bottom, there are Production nodes. Logs are collected in real time through Kafka, and can also be collected in batches through Gizzard into Hadoop. Some data will be stored. After entering the MySQL cluster, the data will enter the Hadoop cluster of your own production environment. Nighthawk allows business departments to use the cluster by themselves. Twitter and the data warehouse Vertica can provide support for analysts, engineers and product managers. MySQL will also store some of the data viewed by BI tools and provide such functions as part of the data warehouse.
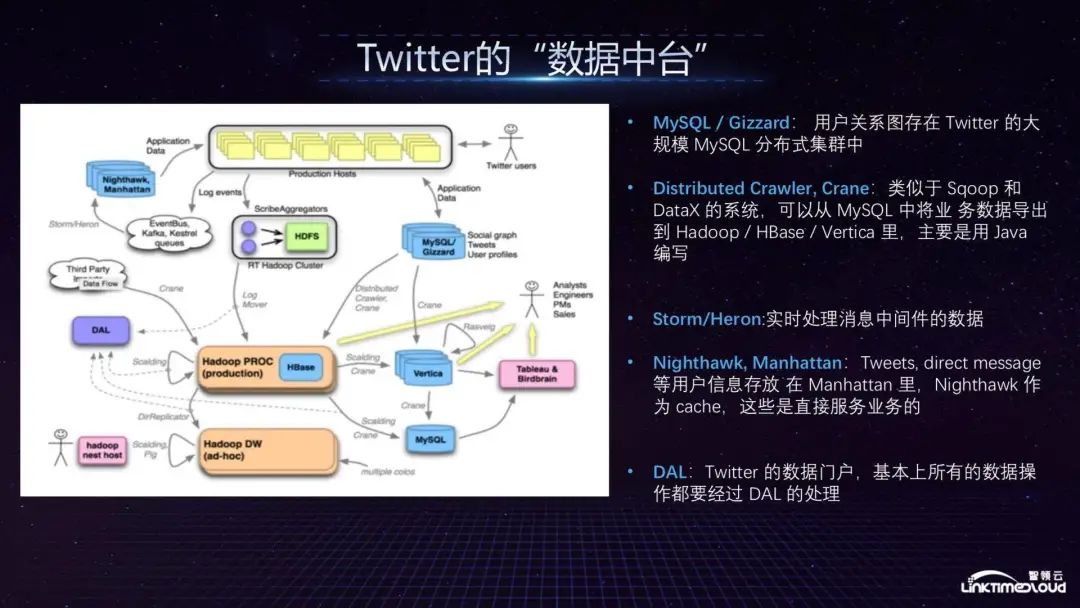
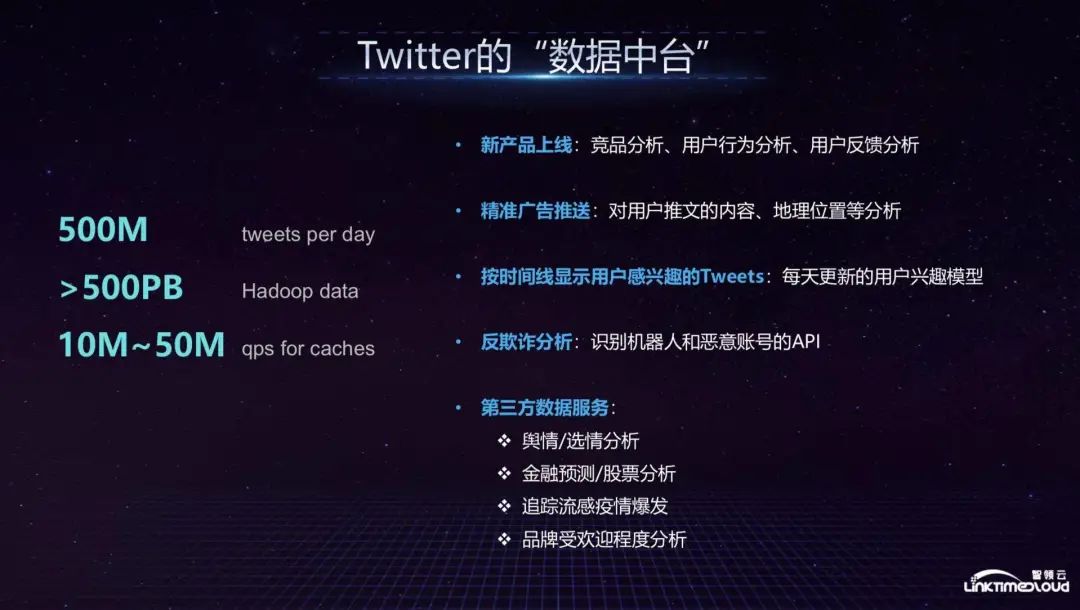
Technically speaking, the focus is on MySQL/Gizzard, which is used by Twitter to store user relationship graphs; Crane distributed collector is similar to Sqoop and DataX systems, and can import business data from MySQL into various data warehouses. This is also an early technology of Twitter, and now it may be replaced by some new open source tools; in terms of real-time processing, Twitter uses real-time collection tools such as Storm/Heron; user information such as Tweets and direct messages are stored in Manhattan, and Nighthawk serves as a cache. It directly serves the business; DAL is Twitter's data portal. Basically all data operations must be processed by DAL. For example, if you need to do some specific analysis on a specific group of people, you can get the data and analyze it within a week or two. Complete data prototype development, which is the abstraction, sharing and reuse of data capabilities. Twitter's data center mainly has a large amount of data. The support for the business is reflected in the analysis of competitive products, user behavior analysis, specific location analysis, etc. before the launch of new products to ensure accurate advertising push. Twitter will also use some data Services are open to the outside world, such as public opinion/election analysis, etc. These are the capabilities of Twitter's data center.
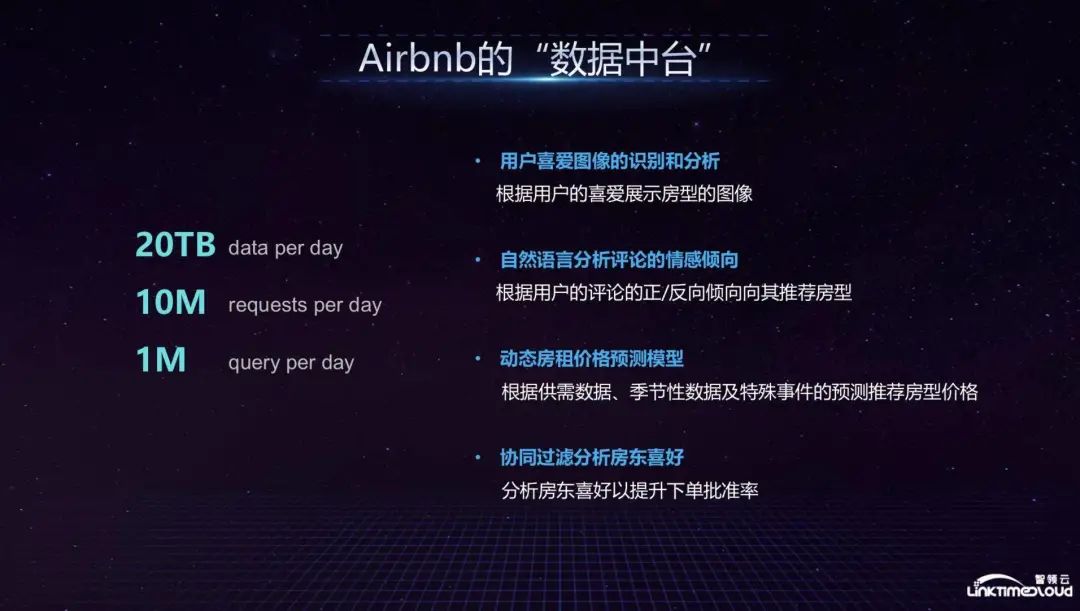
Next is Airbnb. From left to right, the entire data enters the Gold Hive Cluster production cluster from Event logs, MySQL Dumps, batch processing Sqoop, and stream processing Kafka. It has a copy Silver Hive Cluster, which should be similar to some self-service queries. Finally, it flows to the Spark cluster, and the data is basically stored in S3. The underlying layer supports various services through the Presto cluster, such as data analysis of the business department. Airpal allows business personnel to easily write data query requests, and the Tableau open source visualization tool allows the business department to perform self-service visualization. Report analysis.
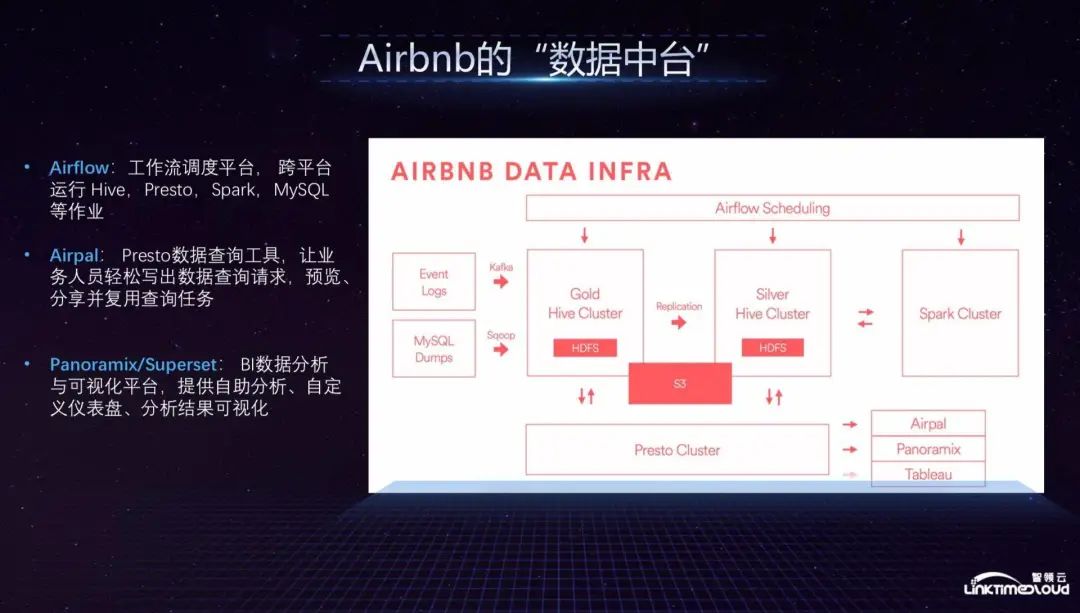
The above is the architecture of Airbnb's data platform. As an online rental ordering platform, the business supported by the data platform is mainly reflected in analyzing users' favorite images through artificial intelligence algorithms. For example, users stay on a certain room type picture for a long time or are interested in the next one. Airbnb will remind the host of the selection and display of display pictures; it will analyze the emotional tendencies of comments through natural language and determine the recommended room type based on the positive/negative direction of user comments; the dynamic rent price prediction model will use supply and demand data, Seasonal data and predictions of special events recommend room types and prices; collaborative filtering analyzes landlord preferences and analyzes landlord preferences to improve the order approval rate. This is Airbnb's entire data center's support for the business.
Finally, let’s look at Uber’s data center. All Uber data enters from Microservices, MySQL, Schemaless and Cassandra respectively. Cassandra has higher requirements for real-time data. The data then enters the data collection platform Marmaray via Kafka, and then enters HDFS. Its characteristic is to use Hudi to do incremental processing in HDFS, because it is difficult to do incremental processing in the original HDFS, but Hudi can implement it efficiently, support many ecosystems through YARN, and finally store the data through the Vertica data warehouse. Capabilities open to business analysts.
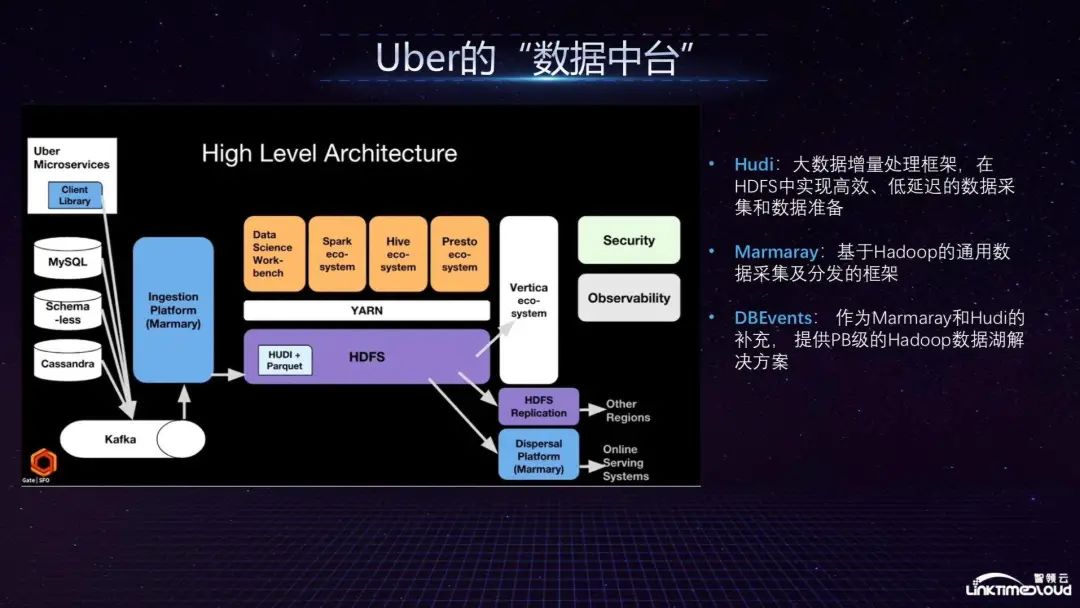
The above is the architecture diagram of Uber's data center. It mainly supports its internal dynamic price adjustment model, which performs real-time price adjustments based on supply and demand relationships and short-term/long-term benefits. It provides various prediction models to remind drivers of high-riding demand points and the impact on cluster resources. Prediction to reduce costs; large-scale real-time data visualization to provide decision-making basis for city operators; provide data models to train autonomous driving, simulate the movement of urban vehicles and pedestrians, and the real conditions of each traffic intersection.
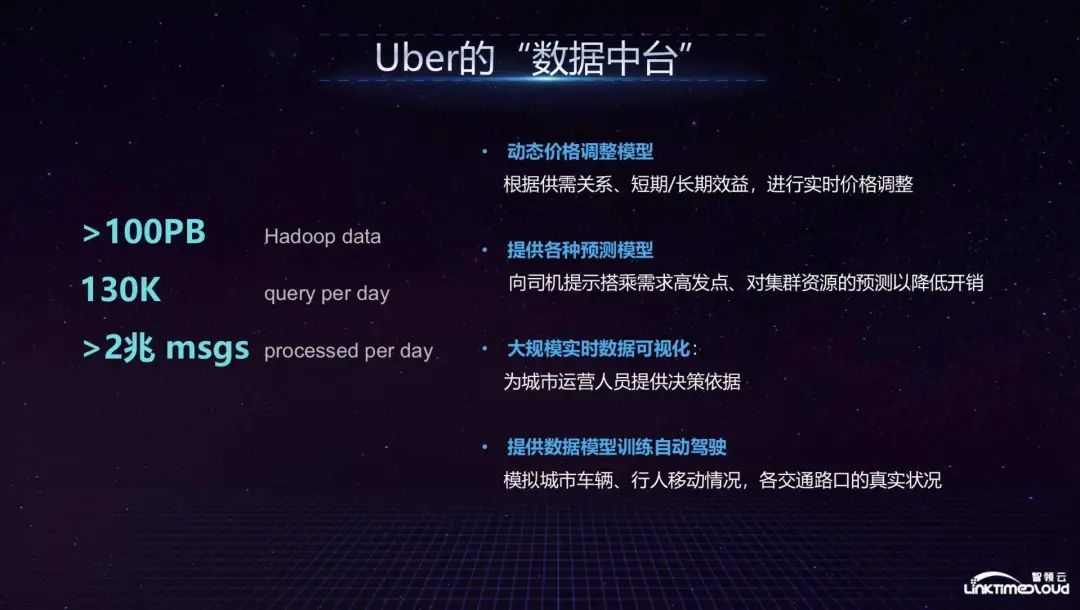
To sum up, we have extracted a few representative points. Uber itself is engaged in the autonomous driving business, so it will also use data to train autonomous driving. This is the support of the entire Uber data center architecture for the business. It is worth noting that they abstract data capabilities through the data center, share and reuse some technical capabilities, so I will talk about some cases from this aspect, hoping to be helpful to everyone.
Q: How are Telemetry indicators specified? What are the main considerations?
A: Telemetry indicators are game data indicators. First of all, they must be able to cover all user behaviors in the game. Secondly, they must be able to provide support for the company's business analysis, including publicly available data such as daily active users, monthly active users, average user duration, average consumption, etc., which must be It should be presented in a prescribed format, and it should also provide some flexibility for the game development department to facilitate self-service analysis. Generally speaking, we will determine the Telemetry framework one year before the game is launched, but we will make some adjustments later. The main thing is to consider what indicators need to be analyzed from a business perspective, and then discuss and iterate on an annual basis.
Q: In the past year, I have heard some cases of failed data center construction. What do you think?
A: I think the construction of data middle platform should be discussed according to the situation of each enterprise. The construction process is divided into stages. When we review the digital driving process of a company, we can find that the first step is to build information technology; secondly, when entering the data warehouse stage, we can Do some statistical analysis on the data warehouse; then when the amount of data is too large for the data warehouse to support, we enter the construction stage of the big data platform, pull the data into the Hadoop ecosystem for distribution, and bring the data together to create offline data Analysis; Finally, as the number of business lines increases, a chimney-like architecture begins to appear in the construction of big data platforms. At this time, it is necessary to provide a unified data center for all business lines and share capabilities to allow business lines to reuse. This is a gradual upgrade process. Enterprises need to look at the stage they are in based on their actual situation to determine whether it is suitable to build a data middle platform.
Q: Are big data platforms and data middle platforms the same?
A: There is a difference between a big data platform and a data center. The big data platform is mainly based on the Hadoop ecosystem. There may be a data pipeline for data collection, data processing, data analysis, etc. It is like EA in the early days if it did not do unified Data specifications and data standards may only bring data together, but they are still essentially chimney-like. In addition, the data center can abstract some data capabilities and share them with other business lines, rather than building data capabilities specifically for a certain business department. Currently, there is no such thing as a data center in Silicon Valley, but the design of their data platform is based on the concept of a center.
Q: What are the general funding and assessment indicators for the construction of Zhongtai?
A: The assessment indicator is mainly the input-output ratio. First, you need to know how much is invested, including hardware resources, human resources, storage costs, etc., and then you need to know in which links these resources are consumed and which business departments use them. Twitter had an interesting case before. They found that the electricity bill was particularly high during a certain period of time, and finally found that a large amount of computing resources were spent on establishing user relationships. If a large number of resources are occupied by a certain non-core business department, it may mean that there is a problem with internal prioritization, and the core department does not receive support from middle-office resources. In terms of usage, rewards are given to business departments that are frequently used, and those that are rarely used are punished.
Q: Are there many companies doing data middle offices in China? How to develop the market?
A: What I need to emphasize is that the data center is not an out-of-the-box product. Each company may have its own set of methodologies and technical foundations to build a platform that meets the company's business characteristics. You can also choose to build a platform among big data platforms. There are still many companies that are engaged in the sharing and reuse of data capabilities and the underlying technical architecture of the data center. There are many companies on the market that are engaged in big data platforms. As far as the market is concerned, many domestic companies have already reached the construction stage of data middle platform, which shows that everyone has begun to think about this issue. In other words, a digitally driven architecture such as data middle platform is indeed necessary. From the past extensive With the current refined operations and the promotion of business development through digital methods, I think the prospects of the data center are still very promising.
